The Ads Overview dashboard lets you review your performance at a glance. Data Studio Lab’s Ads Dashboard includes a summary of your performance and important insights. You’ll find an Overview for your entire account, as well as for individual campaigns and ad groups. Feel free to play with the following live demo of our Ads Dashboard.
The post Google Ads Dashboard : Overview of Ads first appeared on Data Studio Labs .
]]>The dashboard shows the most valuable metrics that give you insight into the performance of your store and the behavior of your customers. This dashboard is built with the ability to change the date range to a previous period and the comparison month and year will get changed accordingly. You can for example change the date range to July 2022 in the following dashboard and see how it changes the charts and other metrics dynamically.
The post Shopify Dashboard : Your Key eCommerce Metrics first appeared on Data Studio Labs .
]]>Monitoring your Cash Flow
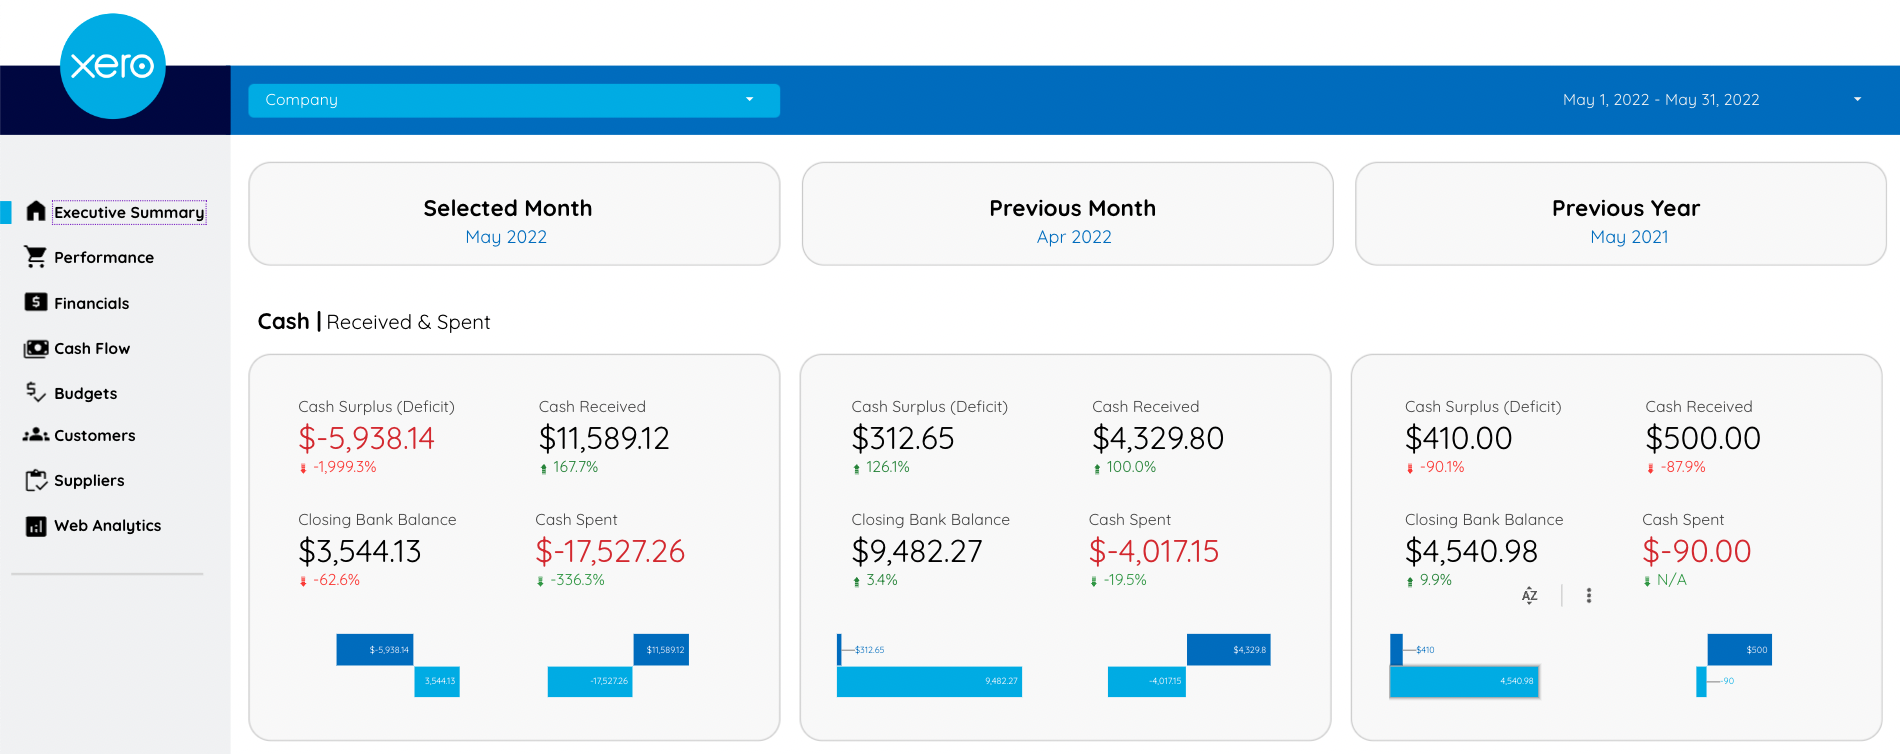
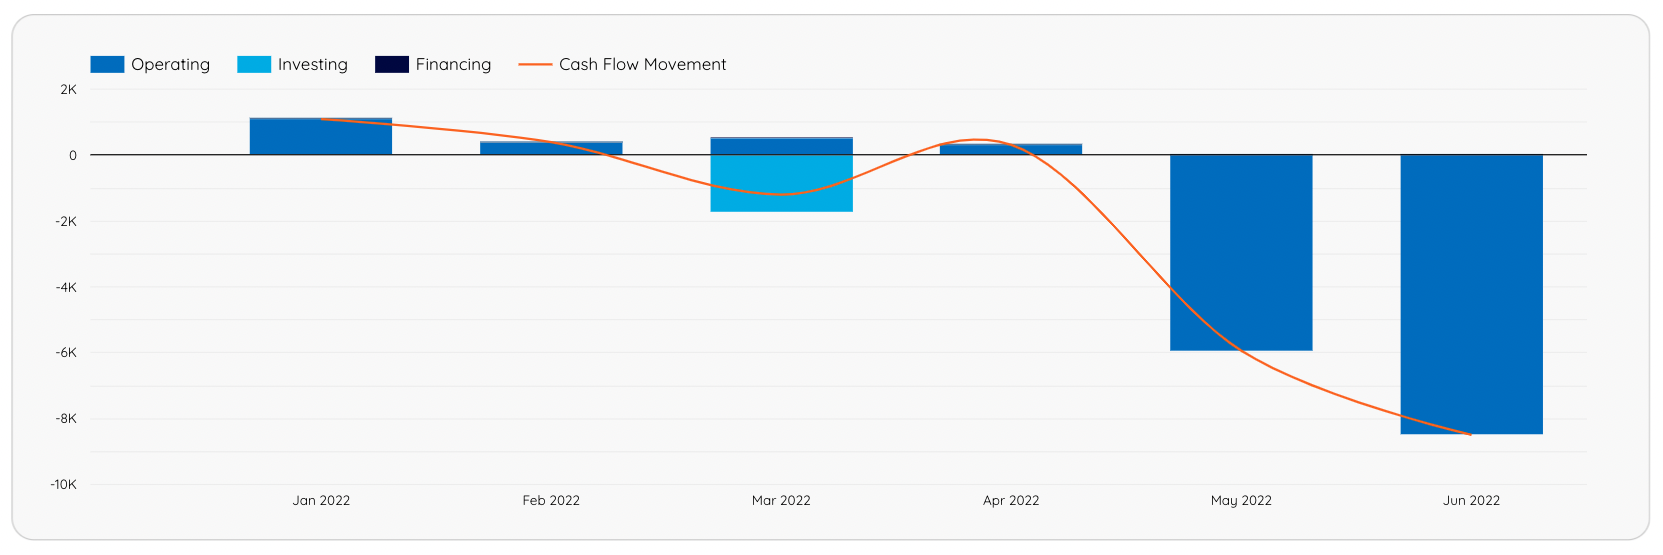
The Xero dashboard includes graphs showing total cash in and out, invoices owed to you, and bills you need to pay, to give you insights into your business cash flow.


Live Xero Accounting Dashboard
Below is a live version of the Data Studio Lab’s “Xero Accounting Dashboard”
The post Xero dashboard: know your numbers first appeared on Data Studio Labs .
]]>